1 Introduction
1.1 Background
The Myanmar National Ecosystem Assessment contributes to the GEF funded Strengthening Sustainability of Protected Area Management in Myanmar project. To support the Myanmar National Ecosystem Assessment, Myanmar’s terrestrial ecosystems were assessed under the International Union for the Conservation of Nature (IUCN) Red List of Ecosystems Categories and Criteria.
This report describes the development of the IUCN Red List of Ecosystems for Myanmar, which included:
- A detailed literature review of all published and unpublished material relevant to the status of ecosystems in Myanmar;
- The development of an ecosystem typology for Myanmar suitable for conducting a national scale IUCN Red List of Ecosystems assessment;
- Production of a guide to the terrestrial ecosystems of Myanmar to describe the units assessed under the red listing criteria (see ecosystem descriptions);
- More than 4000 km of reconnaissance transects traversed across Myanmar to collect georeferenced field data relevant to the mapping and assessment of Myanmar’s ecosystems;
- A country-wide satellite remote sensing analysis to develop high resolution maps of Myanmar’s terrestrial ecosystems from earth observation data;
- The analysis of spatial, biotic and abiotic changes to ecosystems to identify those ecosystems at the greatest risk of ecosystem collapse;
- Application of the IUCN Red List of Ecosystems categories and criteria to each ecosystem in the national typology to develop a list of threatened terrestrial ecosystems of Myanmar; and
- An expert review process for the ecosystem typology, descriptions and assessments.
To promote ecosystem conservation in Myanmar and support national-scale conservation planning and environmental reporting, all data and analysis code have been made open access (see data availability, see Appendices).
1.2 The ecosystems of Myanmar: an overview
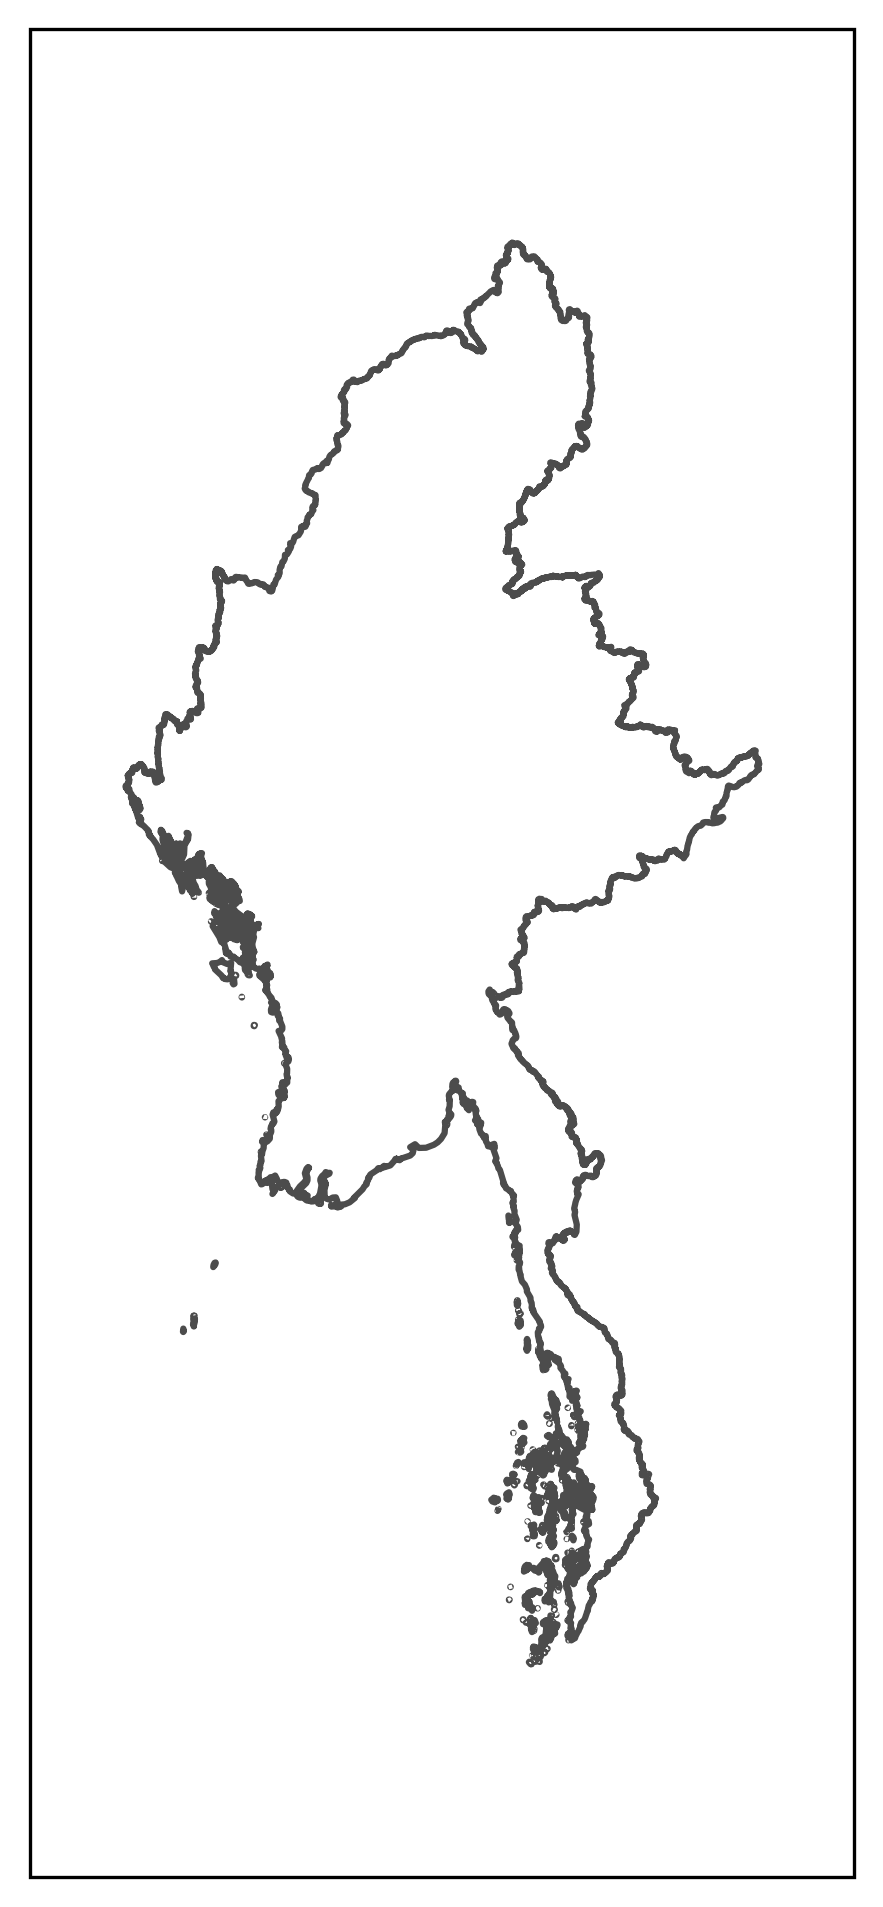
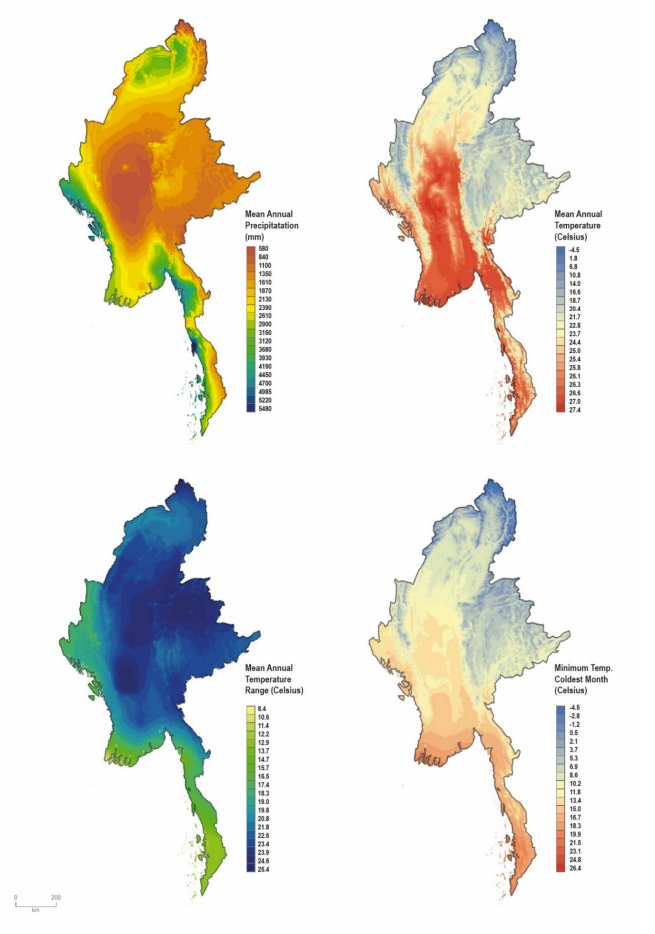
Myanmar (Figure 1.1) has a monsoonal climate throughout its full latitudinal range (9-28°N). The rain-bearing winds come from the south-west across the Bay of Bengal, with the wettest parts of the country being the Tanintharyi coast in the south and the Rakhine Bengal coast in the north receiving in excess of 5,000 mm of rainfall annually (Figure 1.2). The peak rainy season lasts from June to September, with rainfall persisting into October and November. December, January and February constitute the dry ‘cool’ season. Precipitation averages close to zero for the months December-March and, although temperatures are marginally cooler than in the rainy season, much of the country experiences significant rates of evapotranspiration and water deficits, especially in warmer months April and May at the end of the dry season prior to arrival of the monsoon.
The strong seasonal drought, alternating with reliable and abundant rain underpins ideal conditions for development of tropical dry forests, which dominate the majority of the country throughout most of the lowlands, foothills and plateaus. The dry forests are dominated by dipterocarps and teak, and usually have a mixed evergreen-deciduous phenology, with a variable proportion of tree canopies devoid of living leaves in the latter part of the dry season when water deficit is at its maximum. A patchy distribution of dense bamboo breaks through these forests is associated with human disturbance, but may also reflect legacies of natural disturbances such as tropical storms or rare fires.
The effect of the monsoon on water balance within ecosystems is profoundly modified by topography. Coastal lowlands receiving exceptionally high rainfall or areas where evapotranspiration is reduced by topographic shelter or elevation, avoid high water deficits, and may support tropical or subtropical evergreen rainforests. An important example of these forests is found in the Tanintharyi lowlands, where the rainforests are diverse and include Sundaic elements shared with equatorial forests of Malaysia and Indonesia. Other evergreen rainforests are found in the sheltered lowland valleys of the Chindwin and upper Ayeyarwady and on the western rim of the Shan plateau.
A few of the highest tropical mountains and escarpments receiving substantial orographic condensation may support tropical montane fo rests, including mist forests with low, even tree canopies and abundant arboreal bryophytes, lichens, orchids and other epiphytes. These ecosystems are poorly documented in Myanmar, but similar forests have been recorded in other tropical parts of southeast Asia (Ashton 2014).
In other parts of the country, topography reduces moisture inputs and exacerbates loss. The monsoon winds are intercepted by the Arakan Yoma which runs parallel to the west coast and separates the central region of Myanmar from the sea. This creates a marked rain shadow in the centre of Myanmar - the “Dry Zone” were rainfall is as low as 550 mm per annum and exposed flat topography results in major evapotranspirative moisture loss in the dry season. Here, the dominant ecosystems are grassy savannas dominated by acacias and thorny shrubs amongst a continuous ground layer of C4 tussock grasses. The grass layer cures in the dry season, allowing these ecosystems to become fire-prone when ignited by lightning (associated with dry monsoonal storms late in the dry season) or by humans. These savannas extend into the adjacent foothills surrounding the central Ayeyarwady valley, where they are dominated by dry-season deciduous broad-leaf trees. Rainfall generally increases with eleva tion, and landscapes tend to be characterised by savannas with increasingly taller and denser tree canopies on drier (south-facing) slopes, with tropical dry forests, essentially devoid of flammable grasses on more sheltered slopes. Finer textured soils that retain higher levels of moisture and nutrients also tend to favour tropical dry forests over savannas.
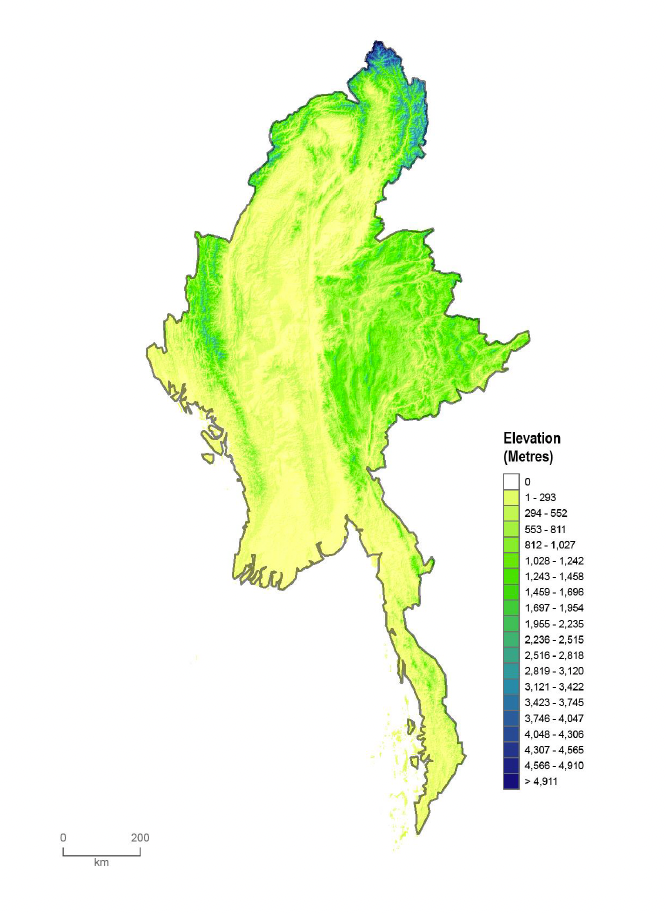
An interesting expression of savanna ecosystems occurs on elevated hills 1000-2000 m above sea level, where reduced evapotranspiration moderates the severity of dry season droughts. These are tall forests dominated by relatively high densities of pine trees, which nonetheless have open canopies promoting seasonal growth and curing of flammable C4 grasses. The trees have high survival rates after surface fires due to their thick insulating bark, but may be killed on rare occasions when intense fires consume their leaf canopies. Pine savannas are scattered through the Kachin, Shan and Chin hills and extend to adjacent countries. Functionally similar pine savannas occur in the Caribbean and southeastern North America. Although the pine savannas contrast markedly with the low, open acacia savannas of the dry lowlands, they are united by their flammable grassy ground layer. With increasing elevation, temperatures decline, mild frosts may occur, precipitation increases and evapotranspirative losses decline. Under these conditions, tropical forests are replaced by temperate forests with simpler structure and lower diversity. These forests are dominated by tree families with strong northern temperate affinities including oaks, chestnuts, laurels and cherries, including a number with winter-deciduous phenology, which become dominant at higher elevations. At higher elevations still, where winter snow persists for weeks or months, these temperate broad-leaf deciduous forests are replaced by temperate montane conifer forests, which become lower in stature and more open with increasing exposure to cold winds. Both types of temperate forests are largely confined to the eastern Himalayan foothills in Kachin state, but limited occurrences extend south to the highest parts of the Chin Hills. At higher elevations, with increasingly cold temperatures, shorter growing seasons and prolonged snow cover, trees give way to alpine shrublands and herbfields, and ultimately to permanent snowfields, glaciers and icy cliffs and screes at more than 5,000 m above sea level (Figure 1.3).
Freshwater ecosystems are partly beyond the scope of this study, but notable examples include glacial lakes restricted to the southern ridges of the Himalayas, seasonal lakes on the Ayeyarwady floodplain and rare geothermal wetlands on the Rakhine coast. Palustrine wetlands on the interface between terrestrial and freshwater realms are extensive on the Aye yarwady floodplain and riparian corridors that extend along the major rivers. These wetlands are densely vegetated with grasses, sedges and other non-woody hydrophytes, and have strongly seasonal filling and drying regimes synchronised with the monsoon. Most dry completely duringJanuary–April, but some retain permanent water. The river banks and levees support forested wetlands with tree recruitment triggered by seasonal flood recession. The lowest part of the floodplain behind the Ayeyarwady deltas includes peat forests (characterised by kanazo), which are uncommon outside equatorial regions worldwide. The interface between the terrestrial and marine realms are occupied by several coastal ecosystems, including several different compositional and structural expressions of mangrove forests, grassy saltmarshes, tidal mudflats and coastal dune vegetation. Finally, subterranean ecosystems are largely beyond the scope of this assessment, but we recognise important karst systems that include extensive dry caves and subterranean waters likely to harbour a diverse and endemic biota, and should be a focus of future assessments
1.3 Introduction to the IUCN Red List of Ecosystems
The IUCN Red List of Ecosystems (RLE) aims to support conservation in resource use and management decisions by identifying ecosystems most at risk of loss or collapse (D. A. Keith et al. 2013, 2015). Similar to the IUCN Red List of Threatened Species, the outcome of an RLE assessment is a list of ecosystems and their status for a region (Figure 1.4; (Rodrı́guez et al. 2011)). Because the RLE was developed to promote a consistent framework suitable for assessing and monitoring the status of ecosystems, it enables comparisons of collapse risk between countries, locations and ecosystem types (D. A. Keith et al. 2013).
For further information on the development of the RLE protocol, the theory and scientific foundations upon which they were developed, and detailed information on the purpose of each of the five criteria refer to the Guidelines for the application of IUCN Red List of Ecosystems Categories and Criteria (L. Bland et al. 2017). More information on the IUCN Red List of Ecosystems, is available in multiple languages on the IUCN Red List of Ecosystems website (www.iucnrle.org).
Assessments of ecosystem types (commonly termed ‘assessment units’ within Red List of Ecosystems assessments) are conducted by applying five criteria and their associated thresholds, enabling each ecosystem type to be classified according to their risk of collapse (termed ‘status’). To ensure the assessment process is transparent and repeatable, each ecosystem type is clearly described according to the IUCN Red List of Ecosystems guidelines (L. Bland et al. 2017). This standard approach of applying the IUCN Red List of Ecosystems Categories and Criteria to clearly described ecosystems is critical to allow for accurate, comparable and repeatable assessments of ecosystems status and to contribute to the global IUCN Red List of Ecosystems programme.
1.3.1 Definitions
There are several key concepts that must be clearly defined to allow for repeatable ecosystem risk assessments:
Risk
Risk is defined as the probability of an adverse outcome over a specified time-frame. Here, the adverse outcome is the endpoint of ecosystem decline, which the RLE terms ecosystem collapse.
Ecosystem collapse
Understanding the concept of ecosystem collapse is critical for interpreting IUCN RLE assessments. For the purposes of the RLE, “an ecosystem is Collapsed when it is virtually certain that its defining biotic or abiotic features are lost from all occurrences, and the characteristic native biota are no longer sustained. Collapse may occur when most of the diagnostic components of the characteristic native biota are lost from the system, or when functional components (biota that perform key roles in ecosystem organisation) are greatly reduced in abundance and lose the ability to recruit.” According to the IUCN guidelines (L. Bland et al. 2017), risks to ecosystems can be caused by a variety of threatening processes that are expressed through different symptoms of ecosystem collapse. The RLE risk model groups these symptoms into four major types, which ultimately form the RLE criteria (Figure 1.5).
For more information on the concept of collapse and how to identify when an ecosystem is collapsed, we recommend referring to the IUCN Red List of Ecosystems guidelines, which describes this in detail (Bland et al., 2017a; Bland et al., 2018). In this report and as recommended by the guidelines, we explicitly define collapse for each ecosystem type in Myanmar in their ecosystem descriptions (See section 3).
Time frames
Because risks must be assessed over specified time frames, a standard set of time frames are carefully defined in the IUCN Red List of Ecosystems Categories and Criteria. There are four specified time frames used in the RLE:
- The historical past. We notionally use the year 1750, which marks the onset of industrial-scale exploitation of ecosystems in South-East Asia;
- The recent past. This is the past 50 years (1969-2019), which is considered long enough to distinguish directional change from natural variability;
- Any 50-year period including the recent past, present and future. Predictions and inferences based on past declines, simulation models and any other model considered suitable for assessing risks into the future may be used.
- The future. Again, predictions are required to assess risks over this time frame and are usually based on models that use information about the response of ecosystems to threatening processes.
1.3.2 IUCN Red List of Ecosystems Categories and Criteria
IUCN Red List of Ecosystems Criteria
To assess the risk of ecosystem collapse, each ecosystem is assessed under five rule-based criteria that form the IUCN Red List of Ecosystems Criteria. These criteria were developed following nearly a decade of scientific work focused on understanding pathways of ecosystem decline, degradation, loss and collapse (Nicholson, Keith, and Wilcove 2009; Rodrı́guez et al. 2011, 2015; D. A. Keith et al. 2013, 2015; L. M. Bland et al. 2017; Murray et al. 2017, 2018; D. A. Keith, Akçakaya, and Murray 2018). Importantly, they relate the symptoms of ecosystem decline with the risk that an ecosystem will lose its defining features. The five criteria were designed to target different symptoms of ecosystem collapse (Figure 1.5). These symptoms are both distributional and functional:
- Criterion A: declines in distribution, which reduce carrying capacity for dependent biota;
- Criterion B: restricted distribution, which predisposes the system to spatially explicit threats;
- Criterion C: degradation of the abiotic environment, reducing habitat quality or abiotic niche diversity for component biota; and
- Criterion D: disruption of biotic processes and interactions
- Criterion E: allows for the integration of the above four symptoms into a simulation model of ecosystem dynamics to allow quantitative estimates of the risk of ecosystem collapse.
For further information on the criteria refer to the Guidelines for the application of IUCN Red List of Ecosystems Categories and Criteria (L. Bland et al. 2017).
Categories
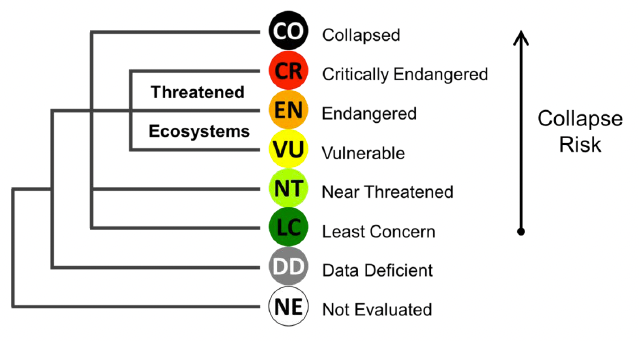
Applying thresholds (decision rules) for each of the IUCN RLE criteria enables each ecosystem to be assigned to a category of risk (‘status’). An ecosystem assessed under the RLE criteria can be placed into eight categories: Collapsed (CO), Critically Endangered (CR), Endangered (EN), Vulnerable (VU), Near Threatened (NT), Least Concern (LC), Data Deficient (DD), and Not Evaluated (NE, Figure 1.4).
The first six categories (CO, CR, EN, VU, NT and LC) are ordered in decreasing risk of collapse. The categories Data Deficient and Not Evaluated do not indicate a level of risk. For further details of the categories refer to the Guidelines for the application of IUCN Red List of Ecosystems Categories and Criteria (L. Bland et al. 2017). We applied version 2.2 of the IUCN Red List of Ecosystems Criteria (Table 1.1).
The IUCN Red List of Ecosystems Criteria, Version 2.2. Source: (L. Bland et al. 2017).
1.3.3 Assessment process
Application of the IUCN Red List of Ecosystems Categories and Criteria follows a generic sequential process that includes:
- Adapting the newly developed global ecosystem typology (D. A. Keith et al. 2020; D. Keith et al. 2022) to the area of assessment (Myanmar’s terrestrial environment, Figure 1.1). This process is guided by experts and the result is a list of ecosystem types for the area of assessment that will be assessed under the RLE protocol;
- Describing each of the ecosystem types in ecosystem typology following the standard approach detailed in the Guidelines for the application of IUCN Red List of Ecosystems Categories and Criteria (L. Bland et al. 2017);
- If no map data is available to support the assessment, an ecosystem mapping project is required to support the ecosystem descriptions and assessment of several of the RLE criteria;
- Applying the assessment criteria to each ecosystem type, which requires extensive data searches and analyses. The outcome of each ecosystem assessment consists of a status of the ecosystem under 5 criteria and 18 subcriteria of the IUCN Red List of Ecosystems categories and criteria;
- Compiling the results into a comprehensive IUCN Red List of Ecosystems for the area of assessment (this report), which describes each ecosystem and identifies ecosystems according to their risk of collapse.
This report details each of these steps in the following sections.